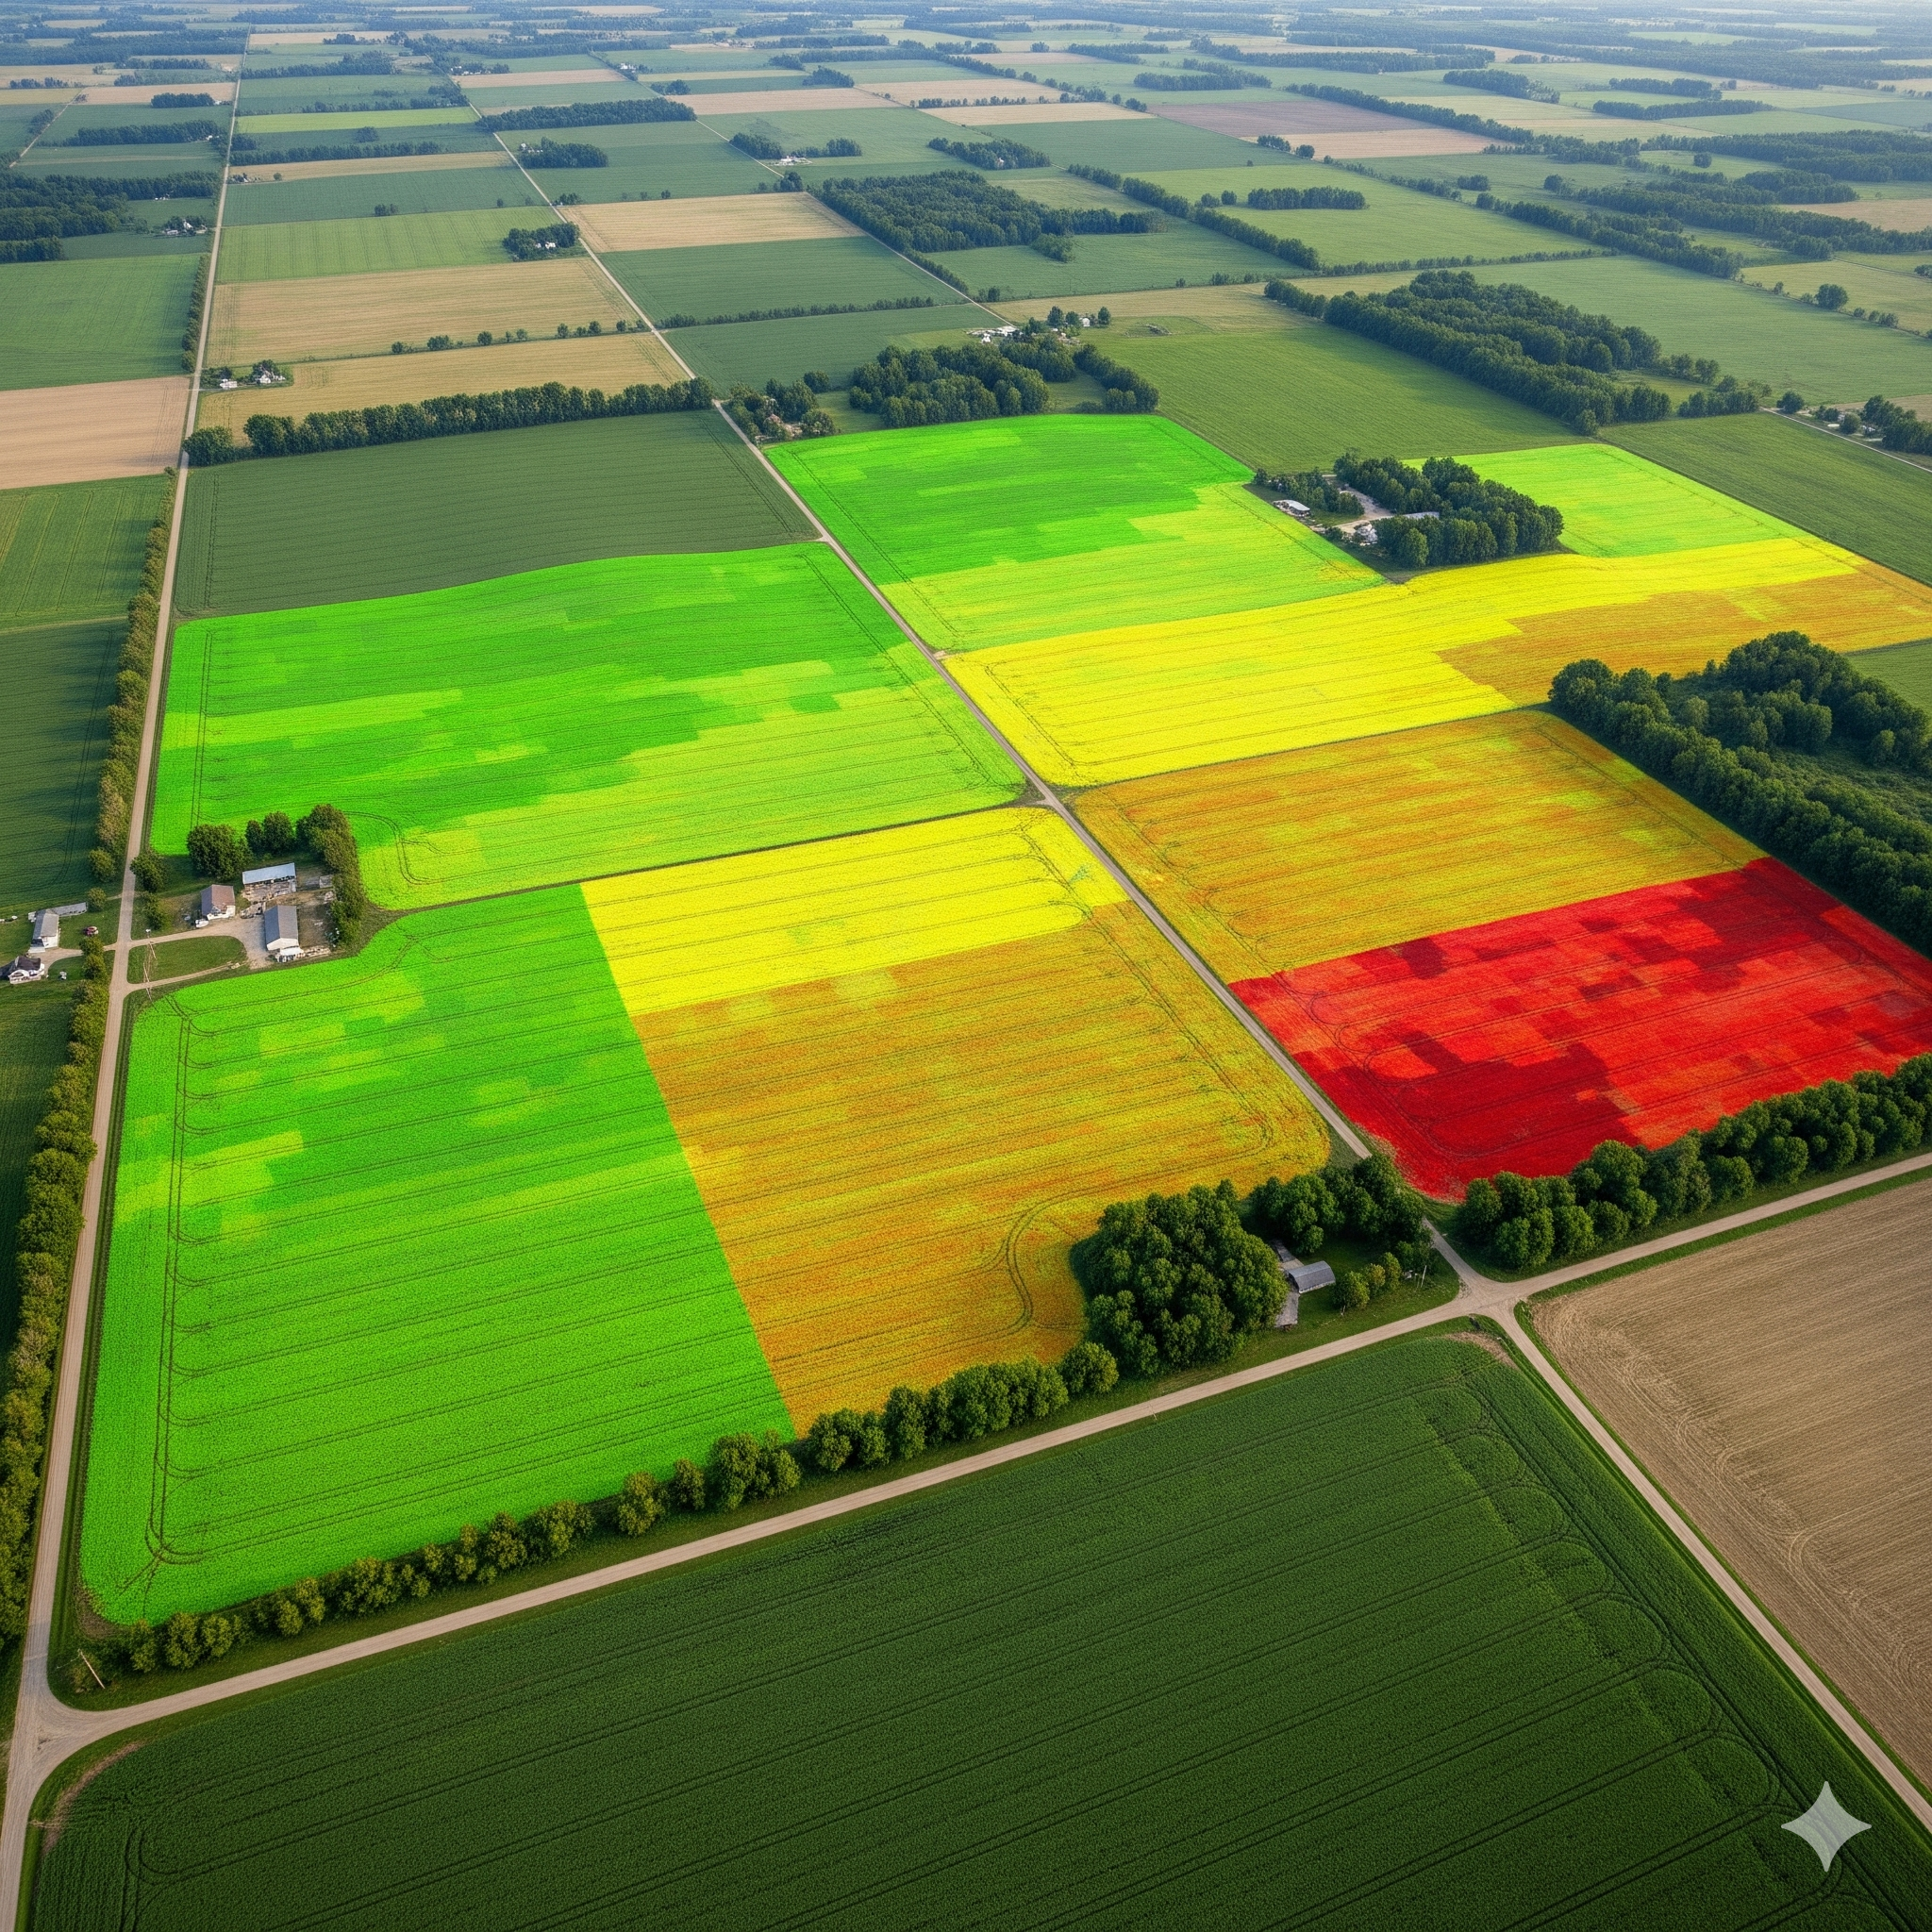
Satellite-based Crop Health Monitoring
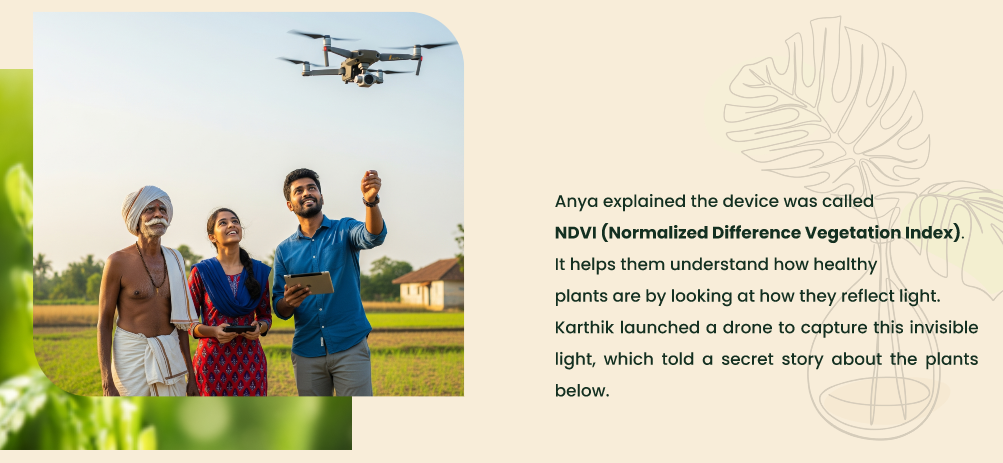
NDVI Data Stories
Version 1.2
- Added reference links for each state card.
Version 1.2
NDVI, or Normalized Difference Vegetation Index, works by
measuring how plants interact with
Red and
Near-infrared (NIR) light.
Healthy, chlorophyll-rich plants absorb red light for
photosynthesis and reflect NIR light efficiently.
(NIR - RED) / (NIR + RED)
The Formula And Output
This Formula Produces A Value Ranging From -1 To +1.
This is what a special camera sees when it looks at a field. Each color on the map tells a story about the plants' health.